
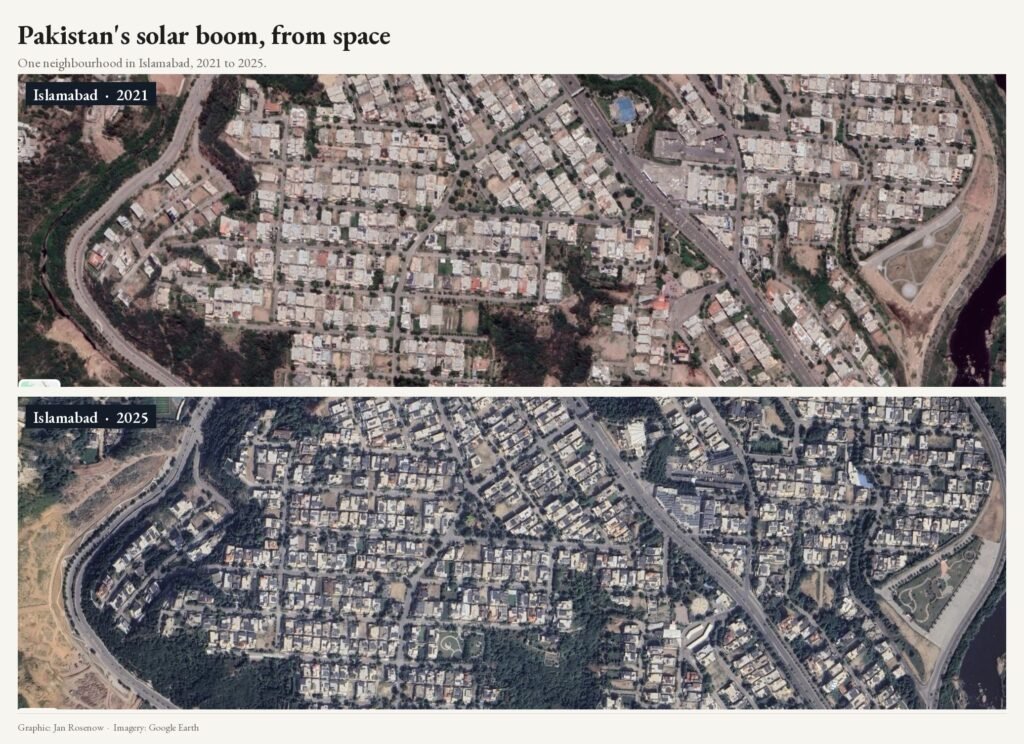

As COP31 promotes a global electrification target for 2035, Pakistan is already experiencing a rapid, largely consumer-led shift towards solar power. Satellite mapping, import data and new energy-sector estimates point to a transformation that is changing how households, businesses and farmers obtain electricity. But the story is more complicated than a simple success narrative.
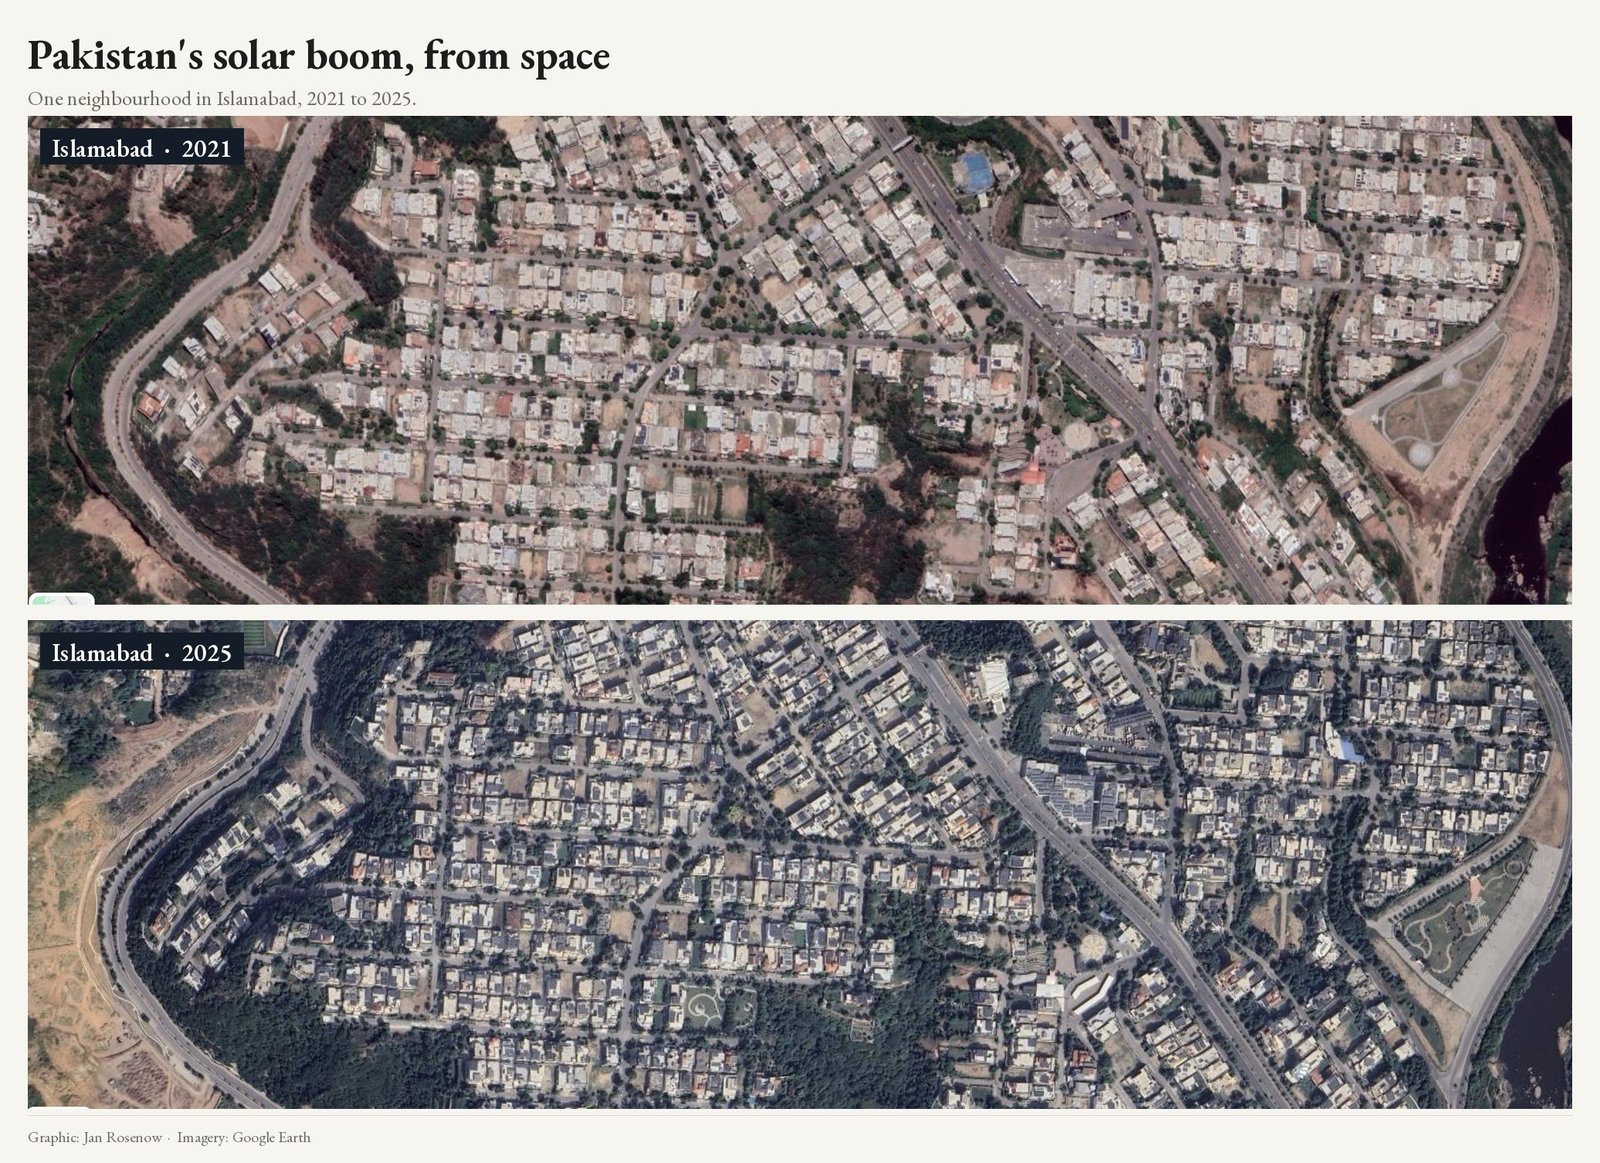
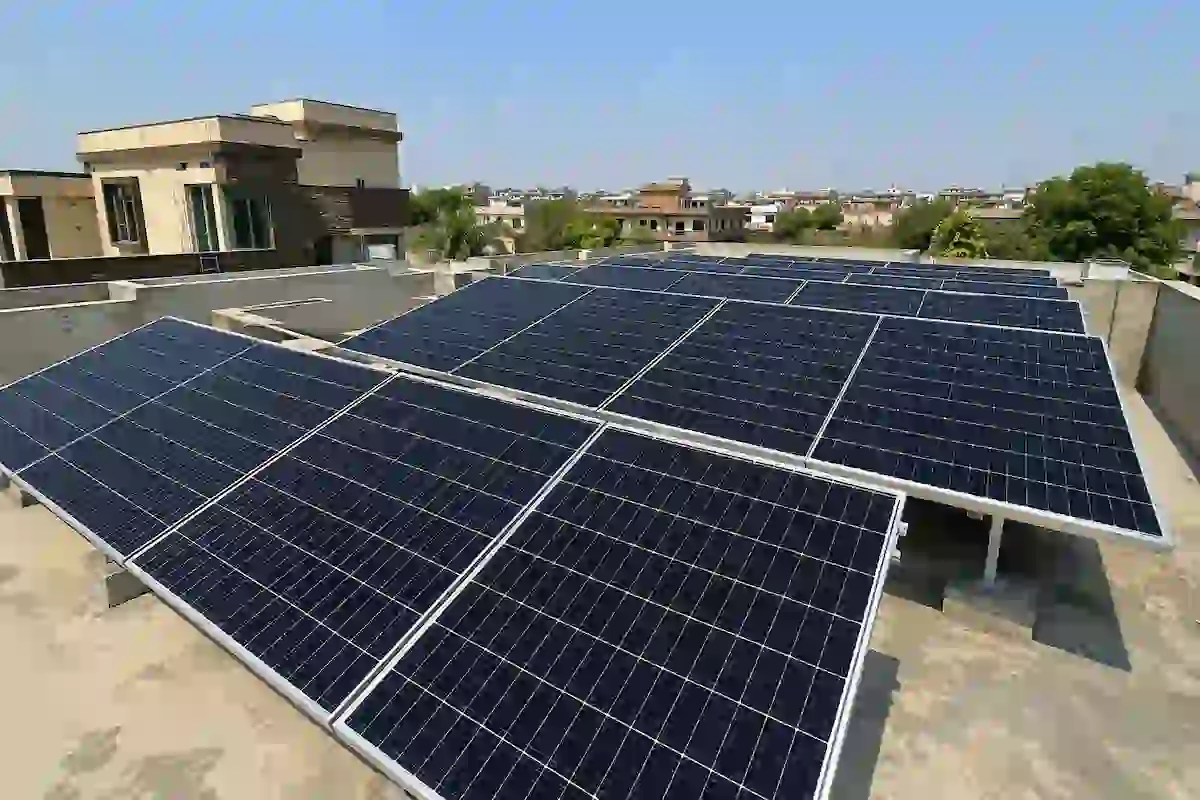
There is something happening in Pakistan that deserves much more attention in the global climate debate. While world leaders are negotiating targets for electrification by 2035, households, businesses and farmers across Pakistan have been investing in solar panels and changing where their electricity comes from.
This transition did not begin as a single, centrally planned national programme. It has been driven by a combination of falling international solar-panel prices, high grid electricity costs, concerns about reliability, changing net-metering arrangements and the ability of consumers to generate power at or near the point where they use it.
The result is a fast-growing distributed solar market. It is also a reminder that the energy transition is not only about building large power stations. It is increasingly about who owns generation, who can afford it, how electricity networks adapt and whether the benefits reach people who cannot finance a rooftop system.
The COP31 question: electrification for what?
Türkiye’s COP31 Presidency has placed electrification at the centre of its climate action agenda. Its 35-by-35 initiative seeks to increase electricity’s share of global final energy consumption from just over 20%—around 23% in the COP31 background material—to 35% by 2035. The ambition covers buildings, transport and industry, and the Presidency says it should be supported by clean power, storage, modern grids and finance.
That distinction matters. Electrification is not automatically decarbonisation. An electric vehicle charged with coal-fired electricity, or an industrial process powered by a fossil-fuel-heavy grid, can still carry substantial emissions. The climate value of electrification depends on how the electricity is generated, how efficiently it is used and how quickly power systems move away from fossil fuels.
At COP31, Reuters reported divisions over whether the global electrification push should be explicitly connected to a transition away from fossil fuels. The voluntary 35-by-35 pledge does not itself require all additional electricity to be renewable or carbon-free. That is the gap at the heart of the debate: a target for more electricity is not the same as a guarantee of cleaner electricity.
Sources: UNFCCC: COP31 Presidency announces global electrification target; COP31 Presidency: 35-by-35 pledge; Reuters: COP31 split over fossil fuels, AI and electrification.
Pakistan’s solar numbers: imports are not the same as installations
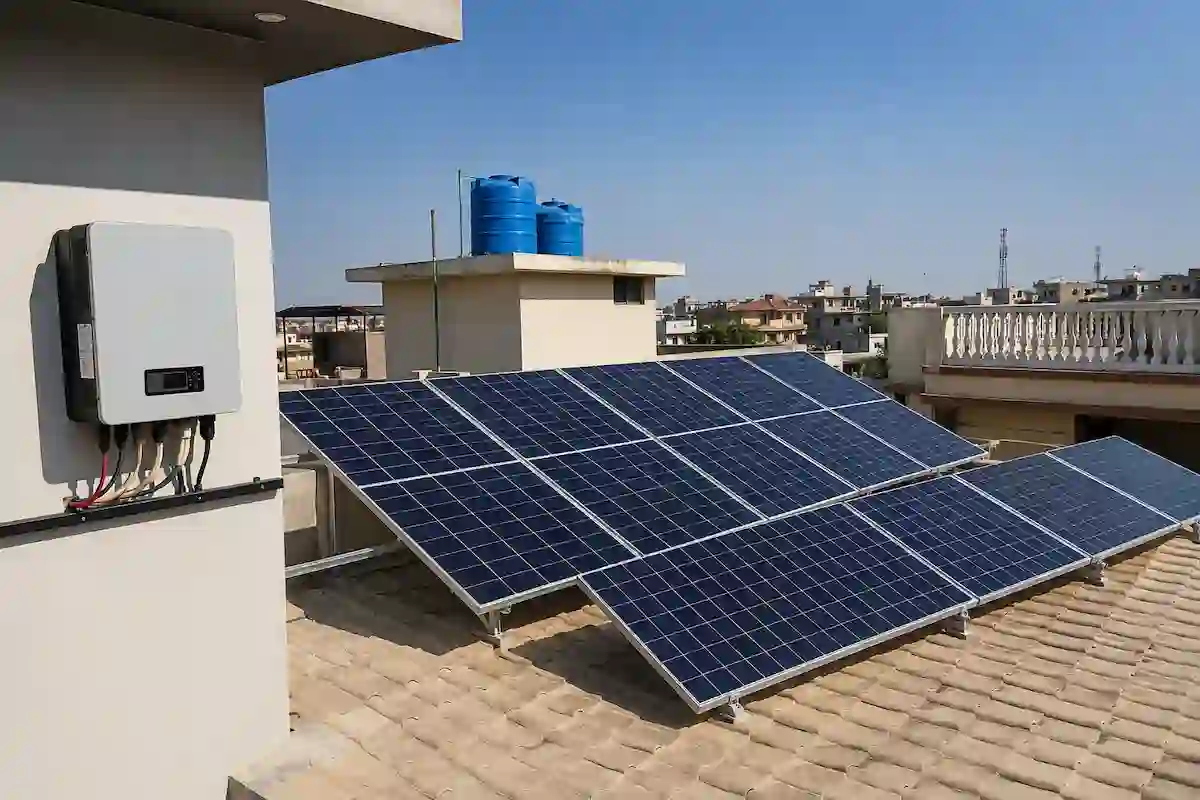
Pakistan’s solar expansion is often described through the number of panels imported into the country. Those figures are important, but they should not be confused with installed or operational capacity. Imported modules may be in warehouses, in transit, awaiting installation or already connected to a home, factory or farm. These are different stages of the supply chain.
Ember’s analysis of Chinese customs data found that 47 gigawatts (GW) of solar panels had been exported from China to Pakistan cumulatively by June 2025. Ember describes this as an upper bound for potential deployment, not proof that all 47 GW had been installed.
For installed distributed solar, Renewables First estimated 38 GW by June 2025. That estimate was built by triangulating field data, market consultations and national statistics, drawing on research by Ember, TransitionZero and the Policy Research Institute for Equitable Development (PRIED). Renewables First estimated that this capacity generated around 51 terawatt-hours (TWh) of electricity in FY2025.
There is another important data point. The State Bank of Pakistan’s State of Pakistan’s Economy, Annual Report 2025–26 cites installed solar capacity of 38 GW in FY2025 and 51 GW by March 2026, based on the Pakistan Electricity Review. It estimates average installed and operational capacity of 44.5 GW during FY2026. Using an assumed capacity factor of 17–20%, the report calculates potential annual generation of 66–78 TWh. It estimates net annual energy-import savings, after accounting for imports of panels, batteries and inverters, of approximately US$4.5–5.5 billion.
These are estimates, not a single meter reading of every solar installation in Pakistan. The State Bank’s figures and the earlier Ember/Renewables First estimates have different reference dates and methodologies. The important point is that multiple independent analyses now indicate a distributed solar fleet measured in tens of gigawatts—far larger than the capacity visible in conventional grid-connected net-metering statistics alone.
Sources: Ember: The solarisation of Pakistan’s energy economy; Renewables First: Pakistan Electricity Review 2026; State Bank of Pakistan: Annual Report 2025–26, Chapter 5.
The satellite view: a solar fleet beyond the official grid register
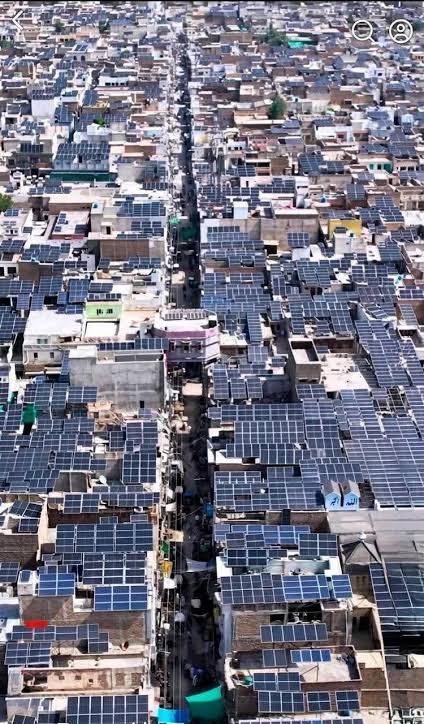
One reason Pakistan’s solar transition has been difficult to measure is that a large share of installations are behind the meter or off-grid. A household using its own panels may reduce the amount of electricity it buys from the grid without appearing in the same way as a utility-scale power station in national generation records. Solar installed on factories, shops, farms and homes can therefore be missed or undercounted when analysis relies only on formal net-metering connections.
TransitionZero and PRIED addressed this gap by combining satellite imagery with a survey of 5,300 households and businesses. TransitionZero used high-resolution satellite images to identify solar installations and scale the observations, while PRIED’s survey provided a separate estimate of adoption across consumer groups. Their analysis estimated 33.35 GW of distributed solar at the time of publication in 2025.
A newer resource, Pakistan’s PV Atlas, uses Sentinel-2 satellite imagery to map detectable photovoltaic installations across the country. Its November 2026 release reports a median imagery date of 23 December 2025 and a detected total of 34,469 megawatt-peak (MWp), with a 90% uncertainty range of 28,626–41,308 MWp. The Atlas makes clear that this is a satellite-detectable inventory, not a complete count of every small system. Its coverage and detection limits matter when interpreting the total.
The Atlas is valuable because it makes the spatial pattern visible and gives researchers a way to explore where solar capacity has been detected. It should not, however, be presented as a verified before-and-after photograph of the same neighbourhood over ten years. A proper 2015-versus-2025 comparison needs matched locations, comparable imagery, consistent resolution and a documented method for identifying new installations. The current public Atlas provides a 2025–26 snapshot; a national rooftop inventory with installation-year attributes is still described as in preparation.
Explore the data: Pakistan’s PV Atlas – interactive satellite map; TransitionZero: Shedding Light on Pakistan’s Distributed Solar Revolution; PV Atlas: open data and methodology.
Solar is changing more than household electricity bills
Ember’s analysis, drawing on Renewables First estimates, suggests distributed solar generated 51 TWh in FY2025, equivalent to around 28% of Pakistan’s electricity generation in the study’s accounting. It estimates that distributed solar generation rose from 15 TWh in FY2023 to 51 TWh in FY2025. Over the same two-year period, total electricity demand increased by 33 TWh, while distributed solar generation increased by 36 TWh. The analysis says grid generation fell by around 3%.
These estimates help explain why the country’s electricity system is under pressure to adapt. When consumers generate more of their own electricity, grid sales and demand patterns change. The grid still matters: households need power at night and during periods of low solar output, and many systems rely on it as backup. Batteries can provide more flexibility, but they add cost and bring questions about supply chains, recycling and safe installation.
Solar adoption is also changing agriculture. Ember’s analysis estimates that agricultural solar deployment reached 8.1 GW, with about 80% off-grid. It reports a rapid increase in solar-powered tubewells between 2022 and 2025, alongside a decline in diesel-powered tubewells. For farmers, solar can reduce exposure to fuel costs and grid interruptions. But cheaper pumping can also increase pressure on groundwater. Without effective water management, an energy solution can intensify a water crisis.
There is also an equity question. Solar systems require upfront investment, suitable roofs or land, and access to credit and technical support. Households with savings can reduce their dependence on grid electricity; low-income renters and families without suitable roofs may not have the same opportunity. A transition led by consumers can move quickly, but it can also widen the gap between those who can buy energy independence and those who remain dependent on the grid.
Source: Ember: The solarisation of Pakistan’s energy economy.
Pakistan, India and the wider Global South
Pakistan is not the only country in the Global South expanding solar power. India reported 135.81 GW of installed solar capacity at the end of 2025, according to its Ministry of New and Renewable Energy. Its broader target is 500 GW of non-fossil electricity capacity by 2030—a target that includes sources beyond solar. India also reported that non-fossil sources had reached half of its installed electricity capacity in June 2025. Installed capacity and actual electricity generated are different measures, and they should not be treated as interchangeable.
Vietnam offers another important example of rapid solar deployment, followed by the challenge of integrating variable renewable generation into the power system. Bangladesh’s experience with solar home systems and solar irrigation offers a different lesson: decentralised solar can reach communities and services where conventional grid expansion is difficult, although affordability, maintenance and long-term programme design remain essential.
Our World in Data’s IRENA-based dataset records 2025 installed solar PV capacity at approximately 135.5 GW for India, 19.25 GW for Vietnam and 210.86 GW for the United States. These national totals are useful for context, but Pakistan’s distributed-solar estimates come from a different combination of sources and methods. A direct league table would therefore be misleading unless the definitions and reporting boundaries were harmonised.
Sources: India’s Ministry of New and Renewable Energy: 2025 clean-energy figures; Our World in Data: installed solar PV capacity.
The United States comparison: scale, demand and fossil dependence
The United States is a useful comparison because it combines high electricity demand with a large and growing renewable-energy sector. According to the US Energy Information Administration, fossil fuels supplied about 58% of US utility-scale electricity generation in 2025. Natural gas was the largest source, followed by coal. Renewables supplied about 24%, while nuclear power contributed around 18%. Small-scale solar generation is reported separately from utility-scale generation in the EIA data.
Ember’s 2026 Global Electricity Review estimates that the United States generated 43% of its electricity from clean sources in 2025, while fossil fuels supplied 57%. It also estimates US per-capita electricity demand at 13.1 megawatt-hours, more than three times the global average. The comparison is not that the United States has made no progress: wind and solar are expanding and storage is growing. The point is that high levels of consumption and continued fossil generation make the pace and scale of the transition consequential.
It is also important not to treat the Global North as one uniform category. Sweden and several other European countries have very different electricity mixes from the United States. China, meanwhile, is the world’s largest solar market and manufacturer but is not usually classified as part of the Global North; it continues to rely heavily on coal while adding renewable capacity at enormous scale. Comparisons should focus on documented energy systems, consumption and emissions—not broad labels alone.
Sources: US EIA: Electricity generation, capacity and sales; Ember: Global Electricity Review 2026 – major countries and regions.
The unresolved challenges: a solar boom is not yet a just transition
Pakistan’s rapid solar adoption should not be romanticised. The country still needs a reliable grid, investment in transmission and distribution, better forecasting, storage, fair and predictable rules for consumers who export power, and a plan for managing the financial consequences of falling grid sales. The transition also needs standards for installation quality, fire and electrical safety, battery handling and end-of-life panel recycling.
For agriculture, solar pumping needs to be linked to groundwater regulation and efficient irrigation. For households, financing models must reach tenants and lower-income communities, not only property owners who can afford a large upfront purchase. For industry, clean electricity must be available at a predictable price if electrification is to support green manufacturing and jobs.
There is a wider climate-finance question too. Pakistan’s solar expansion has been enabled in large part by cheaper imported technology and private spending. That does not remove the need for international climate finance. Grid modernisation, storage, public transport, industrial electrification and access for poorer households require long-term investment. Developing countries should not have to choose between financing basic development and building resilient, low-carbon energy systems.
What should the 2035 target mean?
The 35-by-35 ambition can be useful if it accelerates electrification in transport, buildings and industry. But it needs a clear clean-power pathway. That means measurable progress in renewable generation, storage, grids and energy efficiency, alongside a credible transition away from unabated fossil-fuel power. It also means finance and technology cooperation that reflect the different starting points of countries.
Pakistan’s experience offers a lesson, not a template to copy without adjustment. A decentralised solar market can expand rapidly when technology becomes affordable and consumers have strong reasons to invest. But the public system must catch up: it must make the grid more flexible, protect consumers, manage water resources and ensure that the benefits are not limited to those who can pay upfront.
The question for COP31 is not simply how much of the global economy can be electrified by 2035. It is whether that electricity will be clean, affordable and accessible—and whether countries that have contributed least to historical emissions will receive the finance and policy space to build systems that work for their people.
Pakistan’s rooftops, factories and farms are already part of that debate. The next task is to turn a rapid consumer-led solar shift into a fair, resilient and genuinely low-carbon energy transition.
Sources and further reading
- Ember – The Solarisation of Pakistan’s Energy Economy
- Renewables First – Pakistan Electricity Review 2026
- State Bank of Pakistan – State of Pakistan’s Economy, Annual Report 2025–26, Chapter 5
- TransitionZero – Shedding Light on Pakistan’s Distributed Solar Revolution
- Pakistan PV Atlas – interactive satellite map
- PV Atlas – data, code and methodology
- UNFCCC – COP31 Presidency’s global electrification target
- Reuters – COP31 split over fossil fuels, AI and electrification
- India’s Ministry of New and Renewable Energy – clean-energy figures for 2025
- Our World in Data – installed solar PV capacity
- US Energy Information Administration – electricity generation and capacity
- Ember – Global Electricity Review 2026
Editorial note: Capacity and generation figures in this article are attributed to the organisations that produced them. Estimates differ because studies use different dates, datasets and definitions of distributed, installed, operational and grid-connected solar. The satellite map is a current detection resource, not a matched decade-long before-and-after image series.